Data Transformation Lambdas – Data formatting and transformation
Amazon Bedrock Layer
Knowledge Bases – Foundation for AI capabilities
Agents – Intelligent automation
Guardrails – Safety and compliance
Foundation Models – Claude 3, Titan, etc.
Monitoring & Observability
Amazon CloudWatch – Metrics and logs
AWS X-Ray – Distributed tracing
AWS CloudTrail – API activity tracking
Amazon QuickSight – Business intelligence
Security Layer
AWS KMS – Key management
AWS Secrets Manager – Secure secrets storage
AWS Security Hub – Security posture management
Amazon VPC – Network isolation
Application Visualizations
This repository includes comprehensive visualizations of the application interfaces and user experiences:
1. User Dashboard (Web Interface)
The web dashboard presents a branded interface for THOUTAM Corporation featuring:
Brand Identity: Utilizes THOUTAM’s primary color (#0052CC) throughout the interface
Pending Approvals:
3 contracts awaiting legal review
2 reports pending executive approval
5 documents requiring compliance verification
Recent AI Analyses:
Contract risk assessment
Market trend analysis
Regulatory compliance check
Competitive intelligence summary
2. Document Viewer with AI Analysis
The document viewer integrates intelligent analysis capabilities:
Document Display: Full contract text with section navigation
AI Analysis Panel:SUMMARY This agreement outlines the terms of service between THOUTAM Corporation and the client, including service level requirements, payment terms, confidentiality provisions, and termination conditions.
Key Terms:
Term: 24 months with auto-renewal
Payment: Net 30 days
Early termination fee: 20% of remaining contract value
Confidentiality: 5-year NDA from termination
Document Metadata:
Created: May 1, 2025
Last modified: May 5, 2025
Status: Pending approval
Classification: Confidential
Action Buttons:
Download
Share
Request approval
Run AI analysis
3. AI Assistant Chat Interface
The AI assistant provides contextual document support:
Conversation History:
Contract review
Marketing strategy
Competitor analysis
Regulatory inquiries
Chat Transcript Example:User: What are the key terms in the THOUTAM Services Agreement? AI: Based on the THOUTAM Services Agreement, the key terms include: - 24-month contract term with automatic renewal - Net 30 payment terms with 1.5% late fee - 99.9% uptime SLA with service credits - 60-day termination notice required Would you like me to explain any of these terms in more detail?
Source Citations:
Reference to document section 3.2
Link to full agreement
Reference to previous version changes
Document Summary Cards:
Quick reference cards for mentioned documents
Highlighted relevant sections
Direct links to document viewers
4. Admin Dashboard (Multi-Tenant View)
The admin interface provides system-wide management:
System Health Metrics:
API response time: 87ms avg
Function invocations: 12.5M daily
Error rate: 0.02%
Current system load: 42%
Usage Analytics:
Peak usage periods
Function execution distribution
Storage growth trends
Cost optimization recommendations
Tenant Management:
Provisioning controls
Quota management
Authentication settings
Compliance reporting
Implementation Considerations
The visualization highlights several important implementation details:
Responsive Design: All interfaces adapt to different screen sizes and orientations
Tenant Isolation: Multi-tenant architecture with strict data separation
Serverless Scaling: Automatic scaling based on demand patterns
Cost Optimization: Resource utilization tracking and optimization
Security Controls: Role-based access control and data encryption
Prerequisites
AWS Account with appropriate permissions
AWS CLI installed and configured
Node.js (v18 or later)
AWS SAM CLI
Docker (for local testing)
Setup Instructions
Clone this repository
git clone <repository-url>
cd <repository-directory>
Install dependencies
npm install
Deploy the infrastructure
npm run deploy
Configure the application
npm run configure
Development
Local Development
For local development and testing:
npm run dev
Testing
To run tests:
npm test
Deployment
To deploy to AWS:
npm run deploy
Documentation
For detailed documentation about each component, refer to the /docs directory.
Security Considerations
This application implements security best practices including:
A modular, production-ready Retrieval-Augmented Generation system with agentic capabilities.
Agentic RAG extends traditional Retrieval-Augmented Generation by incorporating autonomous agents that can interact with various data sources to provide comprehensive responses to user queries. The system uses a modular architecture that allows for easy extension and customization.
Architecture
Agentic RAG consists of several key components:
Core: Fundamental data models and interfaces
Memory: Short-term and long-term storage for queries and results
Planning: Components for creating execution plans (ReAct, Chain of Thought)
Agents: Specialized modules for retrieving and processing information
Aggregator: Combines results from multiple agents
Search: Retrieves information from external sources
Local Data: Accesses local file systems and databases
Cloud: Interacts with cloud services (AWS, Azure, GCP)
Generative: Produces human-like responses using language models
Memory: Retrieves information from memory components
Features
Multi-source Retrieval: Integrates information from various sources (web, local data, cloud)
Persistent Memory: Remembers previous queries and results for improved efficiency
Adaptive Planning: Creates and adapts execution plans based on query requirements
Modular Design: Easily extend with new agents, memory components, or planners
RESTful API: Simple HTTP API for integration with other systems
Docker Support: Easy deployment with Docker
Comprehensive Logging: Detailed logs for debugging and monitoring
Configuration Management: Flexible configuration via JSON files and environment variables
PDF Processing: Extract and query information from PDF documents
Installation
Prerequisites
Python 3.10 or higher
PostgreSQL (for long-term memory)
Docker (optional, for containerized deployment)
Using pip
# Clone the repository
git clone https://github.com/jaganthoutam/agentic-rag.git
cd agentic-rag

# Create and activate a virtual environment (recommended)
python -m venv venv
source venv/bin/activate  # On Windows: venv\Scripts\activate

# Install dependencies
pip install -r requirements.txt
Using Docker
# Clone the repository
git clone https://github.com/jaganthoutam/agentic-rag.git
cd agentic-rag

# Build the Docker image
docker build -t agentic-rag .

# Run the container
docker run -p 8000:8000 -v $(pwd)/config.json:/app/config.json agentic-rag
Environment Setup
The system requires API keys for various services. You can set these up in two ways:
Using the Setup Script
We provide a setup script to help you configure your environment variables:
python setup_env.py
This script will:
Check if python-dotenv is installed
Create a .env file with placeholders for your API keys
Prompt you to enter your API keys
Manual Setup
Alternatively, you can create a .env file manually in the project root:
# Environment variables for Agentic RAG
GROQ_API_KEY=your_groq_api_key_here
OPENAI_API_KEY=your_openai_api_key_here
SEARCH_API_KEY=your_search_api_key_here
Required API Keys
GROQ_API_KEY: Required for the Groq LLM provider
OPENAI_API_KEY: Required if using OpenAI as the LLM provider
SEARCH_API_KEY: Required for external search services (optional if using mock search)
Configuration
The system is configured using a config.json file. You can customize various aspects:
The API will be available at http://localhost:8000.
Adding PDF Files for Processing
You can add PDF files to the data folder for processing by the system:
# Add a single PDF file
python add_pdf.py /path/to/your/document.pdf

# Add multiple PDF files
python add_pdf.py /path/to/document1.pdf /path/to/document2.pdf

# Add all PDF files from a directory
python add_pdf.py /path/to/pdf/directory/

# Specify a custom data folder
python add_pdf.py --data-folder /custom/data/path /path/to/document.pdf
Once added, you can query the system about the content of these PDF files.
Example Queries
You can use the example script to test the system:
python examples/example_usage.py
API Endpoints
POST /query: Process a query
GET /health: Check system health
GET /stats: Get system statistics
Example API request:
curl -X POST http://localhost:8000/query \
  -H "Content-Type: application/json" \
  -d '{"text": "What are the latest developments in AI research?"}'
Example query about PDF content:
curl -X POST http://localhost:8000/query \
  -H "Content-Type: application/json" \
  -d '{"text": "What does the PDF document say about machine learning?"}'
Extending the System
Adding a New Agent
Create a new class that inherits from BaseAgent
Implement the process method
Register the agent in the configuration
from core import AgentType, Query, Document, AgentResult
from agents.base import BaseAgent

class MyCustomAgent(BaseAgent):
    def __init__(self, custom_param: str = "default") -> None:
        super().__init__(agent_type=AgentType.CUSTOM)
        self.custom_param = custom_param

    @BaseAgent.measure_execution_time
    def process(self, query: Query) -> AgentResult:
        # Implementation
        documents = [Document(content="Custom result", source="custom_agent")]

        return AgentResult(
            agent_id=self.id,
            agent_type=self.agent_type,
            query_id=query.id,
            documents=documents,
            confidence=0.8,
            processing_time=0.0,  # Will be set by decorator
            metadata={"custom_param": self.custom_param}
        )
Context-Aware Search, Summarization, and Secure Collaboration with Local LLMs
In today’s enterprise landscape, documentation is both an asset and a bottleneck. From compliance-heavy industries like finance and healthcare to fast-moving product teams, knowledge silos slow down decision-making, reduce productivity, and create risk. We built the Enterprise AI Document Platform to solve that.
Enhanced source citation and PDF export of chat responses
Final Thoughts
This project is more than a doc search tool—it’s your enterprise’s AI knowledge layer. We’re bridging the gap between static documentation and dynamic decision-making. Give it a spin, fork it, contribute, and help shape the future of document intelligence.
Telecommunications companies face pressure to deliver personalized, data-driven marketing campaigns in real time. Traditional systems struggle with siloed data, limited personalization, and slow execution. The AI-Powered Campaign Management Architecture using the Model Context Protocol (MCP). MCP acts as a “universal adapter,” enabling telcos to integrate AI models and multi-channel systems within a unified framework.
Legacy campaign systems often struggle to provide personalized experiences. Based on MCP, this issue is tackled with three main components: Context Assembly, Prompt Engineering, and API Orchestration. These elements help AI models understand context, craft personalized messages, and trigger actions across different platforms. The system includes several layers: data ingestion (like streaming Call Detail Records through Kafka), an AI model layer (such as churn prediction with XGBoost, customer segmentation with AutoML, and next-best-action recommendations), the MCP orchestration layer, a RAG pipeline with a vector store for retrieving knowledge, and campaign execution using WhatsApp, SMS (Twilio), email, and Salesforce Marketing Cloud.
1. Industry Challenges: Limitations of Traditional Telco Campaign Systems
Telecom operators manage vast customer bases and multiple services, from mobile and broadband to digital content. Marketing teams in telcos traditionally rely on campaign management systems that segment customers and push offers via SMS, email, or call centers. However, these legacy approaches face several key limitations in today’s competitive environment:
Fragmented and Siloed Data: Customer data (e.g. billing records, call data records, CRM profiles) often reside in disparate systems. Without unification, marketers lack a 360° customer view, leading to generic campaigns.
Lack of Real-Time Insights: Traditional campaigns are built on stale data (monthly churn reports or static segments). There is limited access to real-time, actionable insights (e.g. recent app usage or network events), hindering timely, context-relevant offers.
Limited Personalization: Offers are frequently one-size-fits-all or based on broad segments like “high ARPU customers” or “data pack users.” Without granular AI-driven personalization (e.g. factoring individual usage patterns, preferences), campaign relevance suffers.
Manual, Slow Campaign Cycles: Creating and launching campaigns can take weeks. Hard-coded business rules must be updated by IT, and A/B testing new ideas is cumbersome. This slow cycle means opportunities (like saving a customer about to churn) are missed.
Challenges in Measurement and Optimization: Legacy systems often lack integrated feedback loops. It’s difficult to track campaign performance across channels in real time and dynamically adjust strategies. Marketers struggle to attribute outcomes or rapidly refine campaigns.
These challenges result in ineffective marketing efforts, with lower customer engagement and higher churn. For instance, without a centralized real-time data framework, telcos risk sending irrelevant promotions or missing early signs of dissatisfaction. In a saturated market where consumers demand personalized experiences, such shortcomings directly impact revenue and loyalty.
Telcos recognize that to stay competitive, they must evolve from these traditional systems to AI-driven, real-time campaign management. The envisioned solution needs to break down data silos, analyze customer behavior continuously, leverage predictive models to anticipate needs, and deliver the next best action for each customer at the right moment. The next section introduces an architectural approach to achieve this transformation, centered on the Model Context Protocol (MCP) and AI orchestration.
2. Introducing the MCP Architecture for AI-Powered Campaigns
The Model Context Protocol (MCP), an open standard by Anthropic from late 2024, enhances AI interaction with external data, tools, and services. MCP standardizes connections between AI models and enterprise environments using JSON-RPC 2.0, enabling secure and consistent execution of functions and retrieval of data without custom code.
MCP Architecture Fundamentals: MCP uses a client–server model. The AI application’s MCP client accesses capabilities from external resources (like databases or APIs) running as MCP servers. The MCP layer handles all interactions, authentication, formatting, and tool usage. Integrating a new tool only requires connecting a compatible MCP server.
In telecom campaign management, MCP connects AI components with data sources and communication channels, facilitating tasks like retrieving data, generating messages, and sending offers—all through a standardized interface, improving efficiency.
Core Components of the MCP-Oriented Architecture: This includes three main functions enabled by MCP:
Context Assembly: Collects relevant contextual data, such as customer profiles from CRM systems, usage patterns from data lakes, and knowledge base content. It uses retrieval techniques to ensure AI models have a comprehensive view for tasks like planning retention offers.
Prompt Engineering: Constructs effective prompts for generative models by formatting queries in a manner that yields precise results. Prompts might be templates with inserted context data, guiding tone and compliance for personalized messages.
API Orchestration: Executes actions using coordinated API calls. The AI can trigger tools like WhatsApp Business API, log outcomes to CRM, and schedule follow-ups. MCP manages secure authentication and correct API formatting.
This MCP-centric architecture transforms campaign management into an intelligent agent that integrates data, reasoning, and action seamlessly.
3. End-to-End Architecture Overview
A multi-layered architecture for telco marketing integrates data engineering, machine learning, generative AI, and delivery channels. Below outlines the solution architecture and its key components.
The architecture is divided into distinct layers, each responsible for specific functions
Diagram showing the architecture for an AI-driven campaign management system in telecommunications enterprises. Data moves from ingestion on the left, through AI/ML modeling and an MCP orchestration layer (context assembly, prompt engineering, API orchestration), then into a retrieval-augmented generation (RAG) pipeline with a vector store and LLM (Groq, Ollama, Google AI (Vertex AI), or Amazon Bedrock), ending in campaign execution across various channels (WhatsApp, SMS via Twilio, Salesforce Marketing Cloud, Email).
By addressing the limitations of traditional campaign systems – data silos, lack of real-time insight, limited personalization – the proposed solution integrates streaming data ingestion, predictive analytics, generative AI, and multi-channel orchestration into a unified platform. Key innovations include the use of MCP for standardized AI-tool integration (serving as the “USB-C of AI connectivity” for the enterprise), a Retrieval-Augmented Generation pipeline for grounding AI outputs in telco-specific knowledge, and a layered approach separating data, intelligence, and execution concerns for scalability and clarity.
Benefits Recap: The architecture empowers telecom operators to deliver personalized, contextually relevant campaigns at scale, with agility not possible before. It moves marketing from gut-feel segmentation to data-driven predictions (e.g., knowing exactly who is likely to churn and intervening in time), and from generic mass messages to tailor-made communications for each customer – all automated by an AI agent that understands context and can act across systems. Early adopters in the telecom space have shown that such AI-driven next-best-action approaches significantly boost engagement and retention, giving credence to the potential ROI. Moreover, operational efficiencies are gained: marketers can launch complex campaigns without heavy IT involvement, models continuously learn and improve outcomes, and the system can react 24/7 to events (e.g., instantly targeting a customer who just experienced a network issue with a goodwill offer).
Future Outlook: As we look ahead, several developments are likely to further enhance this architecture:
More Advanced AI Models: The pace of AI improvement is rapid. Future LLMs (including those from the open-source community) will be even more capable, possibly enabling real-time conversation with customers in natural language. We may see multilingual models allowing telcos in diverse markets to generate content in many languages effortlessly, with cultural nuance. Fine-tuning or training domain-specific models for telco (that understand telecom jargon and regulations) could further improve reliability of outputs.
Deeper Integration with Network Events: With 5G and IoT, telecommunication is expanding beyond human subscribers. The campaign system could evolve into a more general “event-driven recommendation engine” affecting not just marketing but also customer experience management. For example, if a network slice is congested, in the future the AI could proactively communicate with impacted users or adjust their service quality dynamically (blurring the line between marketing offer and network management). MCP could integrate with network management tools, making AI an intermediary between customer-facing comms and network operations.
Edge and On-Device AI: Data privacy and low latency might drive some AI processing to the edge or even on devices. Imagine a scenario where certain personalization happens on a customer’s smartphone (via an on-device model) to ensure absolute privacy (the device could generate or adjust the final message). While that’s farther out, the modular architecture could adapt (MCP servers could exist on the edge close to users for faster data access).
Hyper-Personalized Media and Channels: Today we focused on text-based channels. In the future, AI could generate personalized rich media – e.g., short video or audio messages for customers, or interactive content. A generative AI could create a custom infographic about a customer’s usage and savings, sent via email. Channels like AR/VR or in-car notifications (for connected car services) might emerge. Our architecture can extend to new channels by simply adding new API connectors and prompt templates suited to those media.
Stronger Feedback Loops via Reinforcement Learning (RL): We mainly used supervised models and rules. A future improvement is to employ reinforcement learning where the AI agent experiments with different types of messages/offers and learns from direct reward signals (like conversion rate). Over time, it could autonomously find the optimal strategies per customer. This requires careful governance but could yield even better results by exploring creative approaches that humans might not try.
Industry Standards and Interoperability: MCP itself might evolve into a widely adopted standard. We could see a marketplace of MCP-compliant tools – e.g., a vendor might offer an MCP server for “Telco Billing System X”, which any MCP client can use. This would reduce integration efforts when adopting such architectures. Telcos might collaborate on common ontologies for customer data to make AI solutions more portable across organizations (while still guarding their data closely).
Regulatory Evolution: As AI in marketing grows, regulators might impose new rules (similar to how telemarketing and SMS have regulations). We expect frameworks for AI transparency – perhaps telcos might need to inform customers when a message is AI-generated, or allow opting out of AI-driven interactions. Our system can accommodate that by e.g. tagging messages or adjusting logic if such rules come. Being proactive in responsible AI, as we discussed in governance, will prepare organizations for likely regulatory scrutiny on AI fairness and privacy.
Recommendations: For telco executives and solution architects considering this path:
1. Start with a Pilot: Identify a high-value use case (like churn reduction in a segment or upsell for a new service) and implement the architecture on a smaller scale. This could be done with a subset of data and customers to prove the ROI and work out kinks.
2. Invest in Data Foundation: Ensure your customer data platform is robust. This architecture’s efficacy depends on quality data. Cleaning up customer data, unifying it (perhaps adopting a Customer Data Platform), and streaming key events should be early investments.
3. Build Cross-Functional Teams: This solution spans IT, data science, marketing, and compliance. Establish a task force with representatives from each to define goals and oversee implementation. The marketing team’s involvement in prompt design and scenario planning is as crucial as the data scientists’ role in model building.
4. Embrace Iteration: Treat the AI campaign system as a living product. Continuously measure results, get feedback from customers and front-line employees, and refine models and prompts. The beauty of AI is that it can learn – but organizational processes need to learn in parallel.
5. Scale Responsibly: As you ramp up, keep the governance strong. It’s tempting to fully automate, but doing so too quickly can lead to mistakes. Use safeguards, and gradually increase autonomy as confidence grows. Document and communicate clearly how the AI makes decisions, to gain internal buy-in and external trust.
6. Leverage Cloud and AI Services: Don’t reinvent the wheel. Use cloud services like Vertex AI for managed ML ops, existing APIs for communication channels, and possibly partner with AI providers for custom model training. This accelerates development and brings in expert support.
AI-powered campaign management via MCP architecture marks a major advancement in telco marketing, transforming it from batch and reactive to continuous, proactive, and hyper-personalized. By leveraging real-time data, open standards, and human oversight, we can enhance customer experience and drive business outcomes. Early adopters of this approach will gain a competitive edge by engaging customers more effectively and fostering loyalty in a market where switching is easy. The journey is complex but feasible with current technology. The future of telecom marketing lies in the synergy between AI and human creativity, delivering personalized telecom services for each customer.
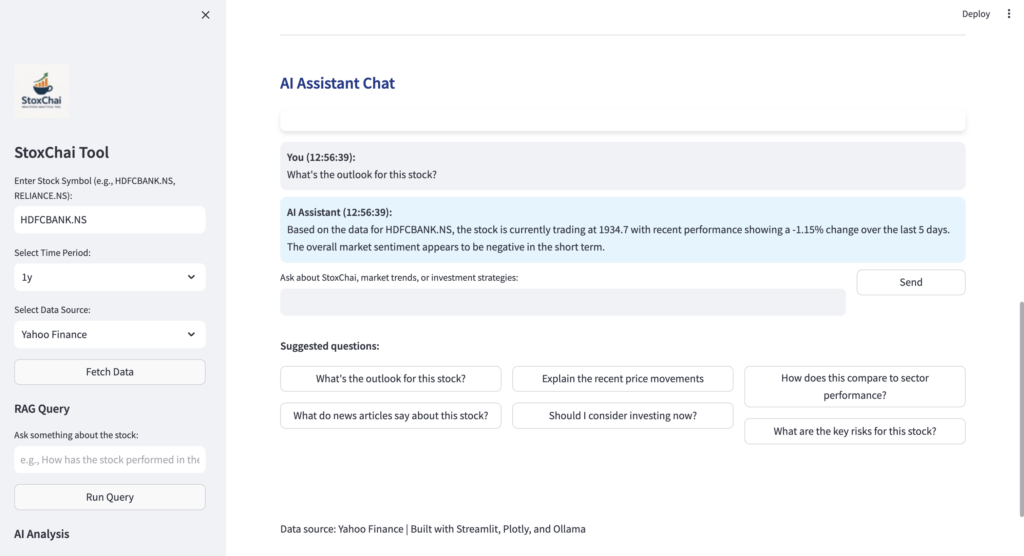
In a world where retail investors are flooded with noise, news, and confusing financial jargon, StoxChai steps in as a refreshing cup of clarity — blending chai-time conversations with AI-driven market intelligence.
What is StoxChai?
StoxChai is an AI-powered financial assistant and stock market research tool designed for modern investors. Built using Python and Streamlit, it combines real-time data visualization, sentiment analysis, and Retrieval-Augmented Generation (RAG) to help users ask natural questions about stocks and receive insightful AI-generated responses.
Whether you’re a retail trader in India analyzing RELIANCE.NS or a global investor tracking trends in HDFCBANK.NS, StoxChai brings AI directly to your financial decision-making process.
Key Features at a Glance 1. Interactive Dashboard: Visualize stock price movements with elegant charts, performance metrics, and technical trends — all in one streamlined view.
2. AI-Powered Sentiment Analysis: Curious about the market’s emotional pulse around a stock? Let StoxChai analyze sentiment using real-time news and data feeds.
3. Chat with the AI: Ask anything — “Is Reliance a good buy this quarter?” or “Show me bearish patterns in the last 3 months.” The AI assistant uses RAG (Retrieval-Augmented Generation) with Ollama-backed models like LLaMA 3 and Mistral.
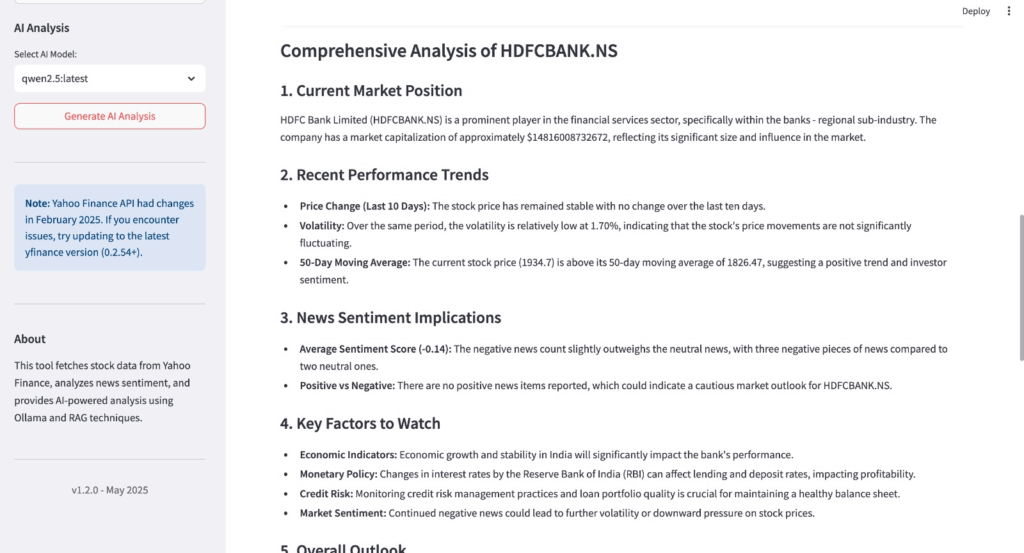
4. Detailed AI Analysis: Get long-form trend analysis, comparative views, and AI-written overviews of stock performance, helping you save hours of manual research.
Under the Hood: Tech Stack
Frontend: Streamlit for reactive dashboards and UI
Backend Intelligence: LangChain for RAG and query pipelines
AI Models: Ollama running local LLMs like llama3, mistral, gemma, and phi
When I started in IT over 15 years ago, Artificial Intelligence was a buzzword you’d only hear in conferences or research labs. Most enterprises weren’t ready, nor were the tools accessible. Fast-forward to today, and I’m living through a real transformation — one that’s changing how we build, ship, and think about software, systems, and services.
This post is not just about the hype or the next big tool. It’s a reflection on how AI has already reshaped the way I work, what I’ve learned, and where I believe it’s going next. If you’re a software leader, architect, developer, or just curious about the AI wave from an enterprise lens — this is for you.
Entering the AI Era: My Path Like many, my first exposure to AI wasn’t through research papers — it was through automation.
I led DevSecOps and platform engineering teams, worked on mission-critical banking systems, migrated massive API gateways, and deployed real-time data platforms across clouds. I wasn’t looking for AI — I was looking for efficiency, speed, and consistency.
But then AI showed up, quietly, inside the tools I was already using.
Copilot started writing chunks of my code.
GitHub Actions recommended workflows.
Monitoring tools began predicting outages.
Even infrastructure provisioning started responding to patterns I hadn’t flagged yet.
What began as passive observation turned into active implementation. By mid-2024, I was testing agentic workflows, using LLMs for RAG-based apps, and exploring how MCP (Model Context Protocol) could drive AI-native services in fintech and real estate.
I moved from automating CI/CD to building AI-first. From writing shell scripts to prompting multi-agent systems.
AI in the Present: Real, Tangible, and Already Working
Let’s stop calling AI “the future.” It’s already here. And it’s doing more than writing essays or making fancy images.
Here’s how AI is already transforming real enterprise work:
1. Software Development
Code Suggestion & Generation: AI isn’t replacing developers, but it’s accelerating them. I’ve used LLMs to generate API scaffolds, write unit tests, and even refactor legacy code in minutes.
Documentation & Compliance: Tools like ChatGPT or custom fine-tuned models are helping teams write clean, standards-aligned documentation — something we usually deprioritized.
2. DevOps & Cloud
Self-healing systems: AI models analyze logs, detect anomalies, and suggest patches before issues escalate.
Infrastructure as Code Optimization: AI audits Terraform or Kubernetes configs, flags inefficiencies, and helps standardize environments across cloud providers.
3. Security & Risk
Behavioral Analysis: In banking, I’ve seen AI systems flag fraudulent patterns that traditional rules missed. These models learn user behavior at scale.
DevSecOps Shift Left: AI scans PRs, aligns them with security benchmarks, and provides real-time feedback.
4. Customer Engagement
Voice + Emotion AI: We’ve moved from text-only bots to voice assistants that understand context, sentiment, and even stress levels.
Chatbots? Think Agents: AI agents can now process documents, make decisions, and complete workflows — not just chat.
So What’s Next? My Predictions for the Next 5 Years AI won’t just be a tool — it will be a layer across all systems.
Here’s what I see coming:
1. Agent-Driven Platforms
We will stop using apps the way we know them. Instead, we’ll describe a goal and an AI agent will use multiple apps on our behalf.
Think:
“Book my compliance review meeting and generate the first draft of the report based on Q2 logs.”
And it happens — securely, traceably, and within org policy.
2. Enterprise RAG Will Be Standard
Every company will have an internal AI assistant trained on its documents, tools, and processes. RAG (Retrieval-Augmented Generation) will become the architecture baseline for all internal search and decision-making systems.
3. AI-Native Products Will Replace AI-Enabled Ones
Right now, we’re adding AI to existing tools. Soon, we’ll build tools around AI — like how mobile apps weren’t just websites on a phone.
These AI-native systems will:
Be event-driven and contextual.
Learn continuously from user behavior.
Interact with other agents and APIs.
4. AI + IoT + Real-Time Systems
For smart cities, logistics, and public services, we’ll see AI models running on edge devices, learning from real-time telemetry, and dynamically updating rules.
In Riyadh, I’ve seen early prototypes — from traffic control to smart building automation — moving in this direction.
5. AI Governance Will Be a Job Role
With AI everywhere, governance, compliance, and transparency will become must-haves. Enterprises will need roles that manage:
API usage monitoring
Prompt governance
Model auditing
Bias tracking
How I’m Preparing (And What You Should Consider)
Learning by doing: I’ve built faceless AI-powered apps, tested LangChain, Llama, and Groq in real scenarios, and explored MCP for end-to-end code generation.
Focusing on architecture: AI is only as good as the data and systems it sits on. If your infra is weak, AI will expose it.
Balancing risk and innovation: I’m integrating AI in banking, telco, and public projects with a “secure by design” approach — not just speed.
Empowering teams: The goal is not to replace people but make them 10x more effective. I coach my teams to use AI tools the same way we use Git or Docker.
Final Thoughts: This Is Just the Beginning
AI isn’t a trend — it’s the next shift in how humans build things. Like cloud, mobile, or the web before it, those who adapt early gain an edge.
We’re not here to fear AI. We’re here to shape it. To embed ethics into algorithms. To build systems that scale human potential, not replace it.
Amazon Connect is a cloud-based contact center service provided by Amazon Web Services (AWS). It allows businesses to easily set up and manage a contact center in the cloud, providing a flexible and scalable solution for customer support, sales, and service.
With Amazon Connect, businesses can create virtual contact centers that can handle voice, chat, and email interactions with customers. It provides a set of tools and features that enable businesses to create personalized customer experiences, while also improving agent productivity and efficiency.
Key features of Amazon Connect:
Interactive Voice Response (IVR): Enables customers to self-serve by navigating through menus and selecting options using their phone’s keypad or voice commands.
Automatic Call Distribution (ACD): Routes incoming calls to the appropriate queue or agent based on pre-defined criteria, such as skill set, language, or customer history.
Call recording and transcription: Records and transcribes calls for quality assurance and compliance purposes.
Real-time and historical analytics: Provides real-time and historical data about call center performance, such as queue metrics, agent activity, and customer feedback.
Integration with other AWS services: Integrates with other AWS services, such as Amazon S3, Amazon Kinesis, and Amazon Lex, to provide additional functionality and customization options.
To create routing profiles, phone numbers, and contact flows in Amazon Connect using AWS CDK, you can use the appropriate constructs provided by the aws-cdk-lib/aws-connect package.
Here’s an example CDK script that creates a routing profile, phone number, and contact flow:
//typescript
//
import * as cdk from 'aws-cdk-lib';
import * as connect from 'aws-cdk-lib/aws-connect';

const app = new cdk.App();

const stack = new cdk.Stack(app, 'AmazonConnectStack', {
  env: { account: '<your_aws_account_id>', region: 'us-west-2' },
});

// Define the Amazon Connect instance
const instance = new connect.CfnInstance(stack, 'MyConnectInstance', {
  identityManagementType: 'CONNECT_MANAGED',
  inboundCallsEnabled: true,
  instanceAlias: 'my-connect-instance',
  tags: {
    Name: 'My Amazon Connect Instance',
  },
});

// Define the routing profile
const routingProfile = new connect.CfnRoutingProfile(stack, 'MyRoutingProfile', {
  name: 'My Routing Profile',
  defaultOutboundQueueId: 'arn:aws:connect:us-west-2:<your_aws_account_id>:instance/<instance_id>/queue/<queue_id>',
  queueConfigs: [{
    priority: 1,
    queueReference: {
      id: 'arn:aws:connect:us-west-2:<your_aws_account_id>:instance/<instance_id>/queue/<queue_id>',
    },
  }],
});

// Define the phone number
const phoneNumber = new connect.CfnPhoneNumber(stack, 'MyPhoneNumber', {
  phoneNumber: '+1234567890',
  instanceId: instance.ref,
  productType: 'SIP',
  routingProfileId: routingProfile.ref,
  tags: {
    Name: 'My Phone Number',
  },
});

// Define the contact flow
const contactFlow = new connect.CfnContactFlow(stack, 'MyContactFlow', {
  name: 'My Contact Flow',
  type: 'CONTACT_FLOW',
  content: JSON.stringify({
    version: '13.0',
    start: {
      id: 'f33c6eeb-4131-470c-93d6-f8117f464a0a',
      type: 'Standard',
      branches: [],
      parameters: {},
    },
  }),
});

// Output the phone number ARN and contact flow ARN
new cdk.CfnOutput(stack, 'MyPhoneNumberArn', { value: phoneNumber.attrArn });
new cdk.CfnOutput(stack, 'MyContactFlowArn', { value: contactFlow.attrArn });
In this example, we define a routing profile using the CfnRoutingProfile construct, setting the name and default outbound queue. We also specify a priority and queue reference for the routing profile.
Next, we define a phone number using the CfnPhoneNumber construct, setting the phone number, instance ID, product type, and routing profile ID. We also set a name for the phone number using tags.
Finally, we define a contact flow using the CfnContactFlow construct, setting the name and content of the contact flow. We also output the ARNs for the phone number and contact flow using the CfnOutput construct, allowing us to easily access them for use in other parts of our application.
By using AWS CDK to define and create these resources, we can ensure that our Amazon Connect infrastructure is created and configured in a consistent and repeatable way, making it easier to manage and maintain over time.
Service Reliability monitoring is essential for ensuring that systems operate reliably and that potential issues are identified and addressed before they become critical problems. In today’s increasingly digital and connected world, downtime or poor system performance can have a significant impact on business operations and customer experience. This essay will discuss the importance of effective Service Reliability monitoring and best practices for achieving it.
Service Level Indicators (SLIs) and Objectives (SLOs) are critical metrics that measure the performance, availability, and reliability of systems. These metrics provide a baseline for measuring the effectiveness of Service Reliability monitoring. SLIs represent key performance metrics, such as response time or error rates, while SLOs represent the target or acceptable range for these metrics. Well-defined SLIs and SLOs provide clear and measurable objectives for Service Reliability monitoring, which align with business goals.
Implementing a monitoring and alerting system is essential for effective Service Reliability monitoring. A monitoring system collects data on SLIs and triggers alerts when these metrics fall outside of acceptable ranges. An effective monitoring system should provide real-time insights and integrations with other tools. Visualizations such as dashboards help present the data in a clear and easy-to-understand way, enabling quick identification of trends and potential issues.
Monitoring the end-user experience is essential to ensuring customer satisfaction. Metrics such as load times, response times, and error rates are essential for understanding the quality of the user experience. A poor user experience can have a significant impact on customer satisfaction and can ultimately lead to a loss of business.
Dependencies on third-party services, APIs, and databases can also impact system reliability. Monitoring the health and performance of these dependencies is critical for identifying issues that may be impacting the system. Logging tools can capture system logs and track system activity, providing additional insights into system performance.
Regular health checks are essential for identifying potential issues before they become critical problems. Health checks should include checking for configuration errors, security vulnerabilities, and other potential issues. Automation can be used to perform these checks and provide alerts when issues are identified, enabling quick response times.
Analyzing and acting on the data collected from Service Reliability monitoring is critical for continuous improvement. Identifying trends and potential issues can enable proactive measures to be taken, such as making changes to the system architecture or implementing new processes. Collaboration across teams, including development, operations, and business stakeholders, is essential for effective Service Reliability monitoring. All stakeholders should have access to monitoring data and be involved in responding to issues.
In conclusion, effective Service Reliability monitoring is essential for ensuring that systems operate reliably and that potential issues are identified and addressed before they become critical problems. Well-defined SLIs and SLOs provide clear objectives for monitoring, while implementing a monitoring and alerting system provides real-time insights and integrations with other tools. Regular health checks, automation, and collaboration across teams are also essential for effective Service Reliability monitoring. By following these best practices, businesses can improve system performance, enhance the user experience, and ensure customer satisfaction.
Site Reliability Engineering (SRE) is a discipline that combines software engineering and operations to ensure the reliability, availability, and performance of a company’s systems. Here are some steps you can take to become an SRE:
Gain a solid foundation in computer science: To become an SRE, you need to have a strong background in computer science, including programming languages, data structures, algorithms, and networking.
Develop strong software engineering skills: SREs must be skilled in software engineering practices, such as version control, automated testing, and deployment.
Acquire experience in operations: SREs must have a deep understanding of operating systems, networking, databases, and infrastructure management.
Familiarize yourself with cloud technologies: SREs often work with cloud-based technologies, such as Amazon Web Services (AWS), Google Cloud Platform (GCP), or Microsoft Azure. It’s important to familiarize yourself with these technologies and understand their capabilities and limitations.
Learn automation tools and technologies: SREs rely heavily on automation to manage and maintain systems at scale. Familiarize yourself with automation tools and technologies such as Puppet, Chef, Ansible, and Terraform.
Understand monitoring and alerting: SREs must be skilled in monitoring and alerting technologies to identify and address potential issues before they become major problems.
Develop excellent communication skills: SREs must be able to communicate effectively with both technical and non-technical stakeholders to explain complex technical concepts in plain language.
Be proactive and able to troubleshoot: SREs must be proactive in identifying potential issues and skilled in troubleshooting when problems do occur.
Be passionate about continuous improvement: SREs must be passionate about improving the reliability, availability, and performance of systems, and must be willing to constantly learn and adapt to new technologies and practices.
Consider pursuing relevant certifications: Certifications such as AWS Certified DevOps Engineer, Google Certified Professional Cloud DevOps Engineer, or Microsoft Certified: Azure DevOps Engineer Expert can demonstrate your expertise in SRE-related technologies and practices.
Site Reliability Engineering (SRE) is a discipline that incorporates aspects of software engineering and applies them to infrastructure and operations problems. The main goals are to create scalable and highly reliable software systems. In general, an SRE team is responsible for the availability, latency, performance, efficiency, change management, monitoring, emergency response, and capacity planning of their service(s).
SRE Principles
Find Service Level Service Level Indicator(SLI), Service Level Object(SLO) & Service Level Agreement(SLA) are parameters with which reliability, availability and performance of the service are measured.
Error Budgets •An error budget is 1 minus the SLO of the service. A 99.9% SLO service has a 0.1% error budget. If our service receives 1,000,000 requests in four weeks, a 99.9% availability SLO gives us a budget of 1,000 errors over that period.
Eliminate Toil Toil is the kind of work tied to running a production service that tends to be manual, repetitive, automatable, tactical, devoid of enduring value, and that scales linearly as a service grows. SRE job is to eliminate as many as Toils by Automating stuff
Automate Everything SRE team Automation provides – Consistency as systems scale – A platform for extending to other systems – Faster repairs for common problems – Faster action than humans – Time savings by decoupling operator from
Support Releases Running reliable services requires reliable release processes. Continuously build and deploy, including – Automating check gates – A/B deployments and other methods for checking sanity SRE don’t afraid to roll-back a problem release.